Bitcoin Price Loiters Above $30k As Accumulation Interest Dips: Slippery Road Ahead?
Analysts and industry experts are attributing Bitcoin’s failed movement above $30,000 to various factors, including a sudden interest in XRP and tokens the SEC deemed securities in early June, including Cardano (ADA), Solana (SOL), and Polygon (MATIC).
When Is Bitcoin Price Likely To Breakout?
The largest cryptocurrency has remained unchanged in 24 hours and trading at $30,102 on Tuesday as investors bid farewell to the Asian session ahead of the European session. Bitcoin has a market cap worth $584 billion, with $14 billion of trading volume coming in.
Based on the daily chart, Bitcoin price is not far from a rectangle pattern breakout but Jake Boyle, the CCO at Caleb & Brown, an Australian crypto exchange, the ongoing stagnation may last longer with minor up-downs until the market encounters some key events.
The daily chart shows BTC holding the bullish rectangle support, from which a breakout may trigger a 10% move from $30,000 to $33,000. For this breakout to come into play, bulls must defend the support at $30,000 and push for sustained price movement above $31,500, representing the rectangle resistance.
Recommended Articles

Crypto Presale Projects For 2023 To Invest; Updated List
Must Read
Best Crypto Exchange Affiliate Programs In 2023
Must Read
Top Crypto Marketing Firms / Agencies 2023; Here’s Best Picks [Updated]
Must Read
Crypto Telegram Channels List 2023 [Updated]
Must Read
Top 10 Web3 Games To Explore In 2023; Here List
Must Read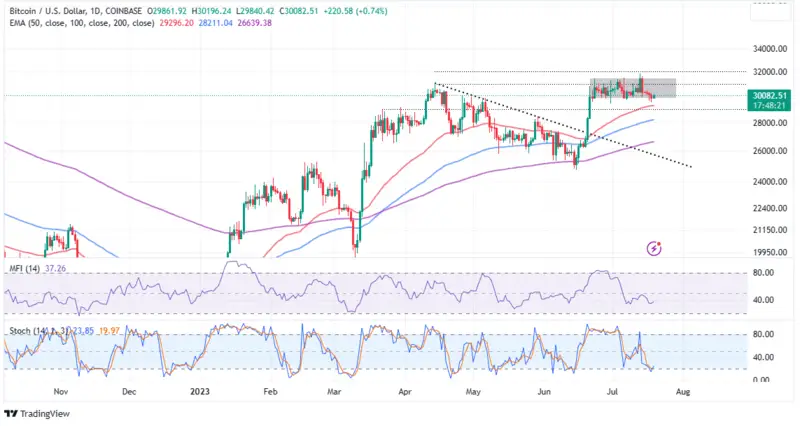
Traders eyeing exposure to new BTC longs may want to wait for confirmation from volume indicators like the Money Flow Index (RSI) and the On-Balance-Volume (OBV).
As the MFI climbs above the midline and toward the overbought region, it shows that investors’ risk appetite for BTC is growing—and subsequently building momentum behind the world’s most prominent crypto asset.
Although Bitcoin is still finding the right path out of the woods, the situation is not that dire, especially with the Stochastic indicators sending a bullish signal. Longs traders can sit tight as long as the oscillator is reversing the trend from the oversold region.
A Slump In Investor Interest Means A Slippery Road Ahead
According to CryptoQuant on-chain analyst Crazzyblockk, the short-term holder (STH) realized price (less than 6 months) has witnessed a considerable drop in accumulations interest among new investors. This cohort says in the market between one and three months.
Furthermore, the Bitcoin price recovery is likely depressed by both the short-term and long-term (3 – 6 months) realizes prices, which hold at $27,200 and $25,800. If combined, their realized prices average around $28,500.
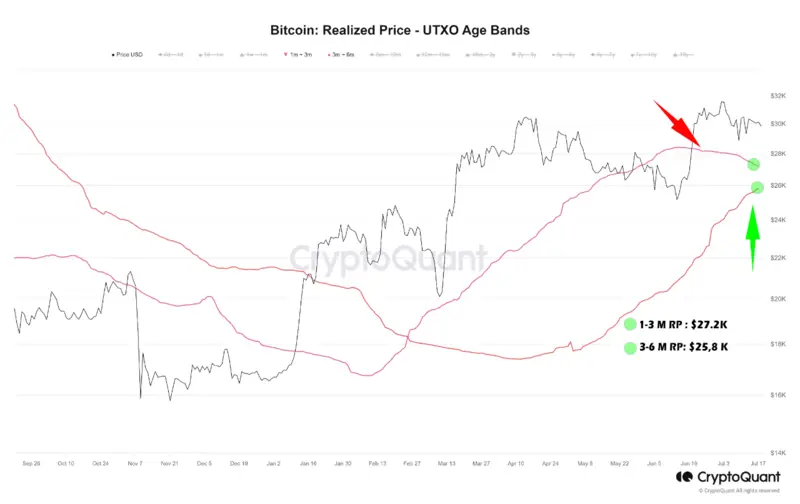
As of July 18, both bands had recorded impressive gains, with profits standing at 9.5% and 15.5% respectively. Nonetheless, in the event of a price correction, it is plausible that these holders may experience a certain degree of selling pressure.
Notably, any strong signs of selling pressure below $30,000 could trigger panic among investors who are betting on Bitcoin price to rally to $35,000 and $38,000. That said, it is still premature to rule out declines to $28,000 and $25,000, especially with BTC hovering at $30,000.
Related Articles
- Breaking: Presidential Candidate RFK Jr. Plans To Back US Dollar With Bitcoin & End Taxes
- S2F Creator Predicts $500K Price for Bitcoin in Next Halving
- Breaking: Bankrupt Celsius Reaches Settlement To Pay $24 Million Over GK8 Sale